How to Analyze Customer Feedback and Behavior for Actionable Insights
 Thu Nghiem
Customer feedback and behavior often tell different stories—praised features go unused, high ratings mask low retention. Learn how to reconcile these gaps, turn raw data into decisions, and close the divide between what customers say and do.
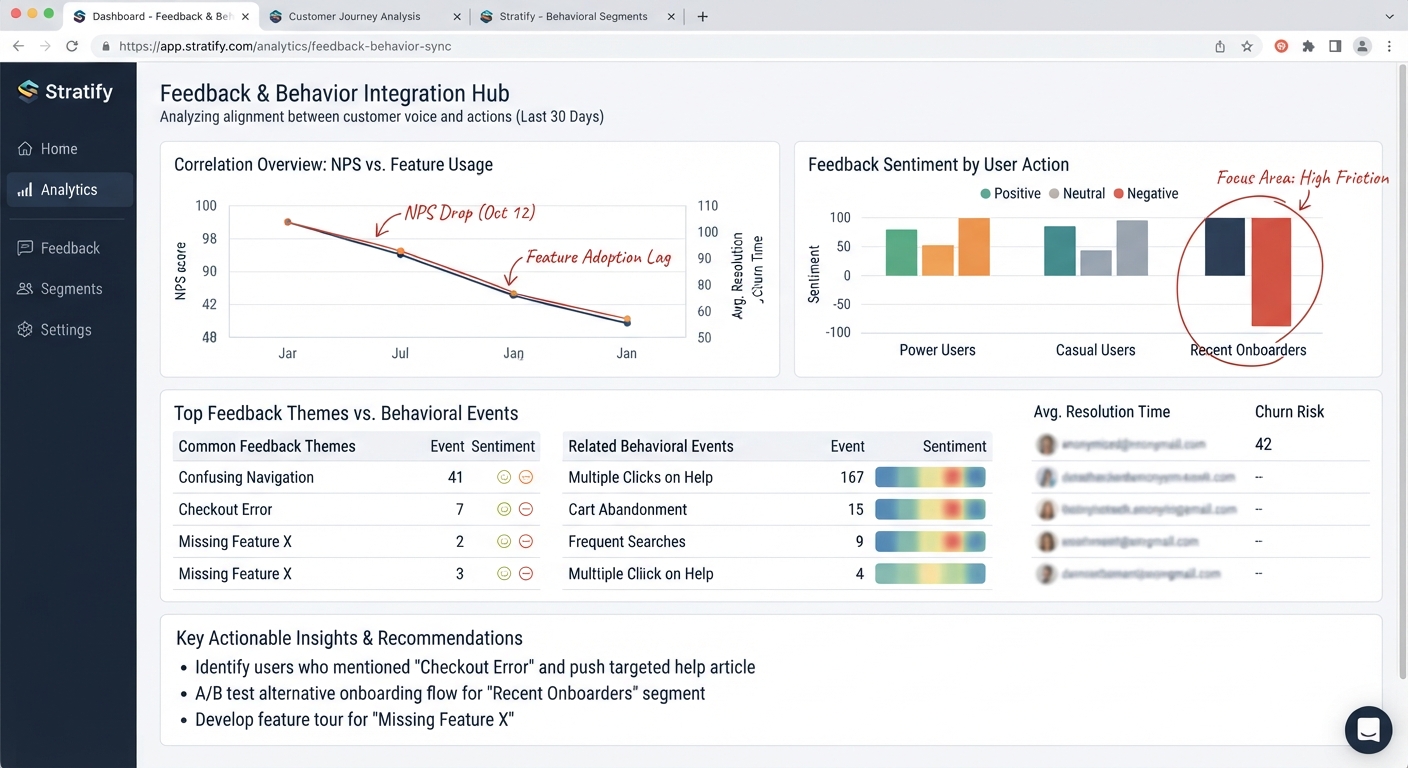
Your customers tell you one thing in surveys—but their actions tell a different story. A feature praised in feedback sits unused. A product rated highly in reviews sees low repeat purchases. These gaps between what customers say and what they do create blind spots that cost businesses time, revenue, and trust.
The solution isn’t to choose between feedback or behavior. It’s to analyze both together, reconcile their differences, and turn raw data into decisions that improve experiences. This guide covers how to collect, compare, and act on feedback and behavioral data—so you can close the gap between customer words and actions.
Why Feedback and Behavior Both Matter
Customer feedback and behavior are two sides of the same coin. Feedback—collected through surveys, reviews, or support tickets—reveals what customers think they want. Behavior—tracked through clicks, purchases, or session recordings—shows what they actually do. Relying on just one source risks misalignment:
- Feedback alone can be biased. Customers may overstate satisfaction in surveys or focus on recent frustrations, skewing priorities.
- Behavior alone lacks context. High drop-off rates might signal confusion, but without feedback, you won’t know why users leave.
The Cost of Misalignment
Consider a SaaS company that launches a new dashboard feature. Post-launch surveys show 90% of users rate it as "easy to use," but behavioral data reveals only 20% of users return to it after the first week. The feedback suggests success; the behavior reveals a retention problem. Without analyzing both, the team might double down on a feature users don’t actually value—or worse, ignore a critical usability flaw.
Key takeaway: Feedback tells you what customers think; behavior shows how they act. Together, they provide a complete picture of customer needs.
Step 1: Collect Data from Both Sources
To reconcile feedback and behavior, start by collecting data systematically. Use consistent timeframes, segments, and triggers to ensure comparability.
Collecting Feedback
Feedback comes in two forms: quantitative (ratings, scores) and qualitative (open-ended responses).
| Type | Tools | Best Practices |
|---|---|---|
| Quantitative | NPS, CSAT, Typeform, SurveyMonkey | Keep surveys short (3–5 questions). Use Likert scales for consistency. |
| Qualitative | User interviews, support tickets | Ask open-ended questions (e.g., "What’s one thing we could improve?"). |
| Passive feedback | App store reviews, social media | Monitor unsolicited feedback for unfiltered insights. |
Pro tip: Trigger surveys at key moments (e.g., post-purchase, after onboarding) to capture relevant feedback. Avoid survey fatigue by limiting frequency.
Tracking Behavior
Behavioral data is implicit—it’s what users do, not what they say. Focus on metrics that reveal intent, friction, or engagement.
| Metric | Tools | What It Reveals |
|---|---|---|
| Click-through rates | Google Analytics, Hotjar | Which features or CTAs users engage with (or ignore). |
| Session recordings | Hotjar, FullStory | Where users hesitate, scroll, or abandon tasks. |
| Drop-off rates | Mixpanel, Amplitude | Points in the user journey where users leave. |
| Time on page/task | Google Analytics, Crazy Egg | Whether users find content useful (long time) or confusing (short time). |
| Conversion funnels | Kissmetrics, Heap | Steps where users fail to complete a goal (e.g., checkout, sign-up). |
Pro tip: Segment behavioral data by user type (e.g., new vs. returning customers) to spot patterns. A high drop-off rate might matter more for new users than power users.
Step 2: Identify Gaps and Patterns
With data in hand, the next step is to compare feedback and behavior to spot misalignments. Look for themes in feedback and correlate them with behavioral signals.
Qualitative Coding for Feedback
Group open-ended feedback into themes using qualitative coding. For example:
- Theme: "Ease of use"
- Feedback examples: "The dashboard is intuitive," "I love how simple it is."
- Behavioral signal: Low time-on-task for new users (suggests confusion despite positive feedback).
Tools for coding:
- Manual: Spreadsheets (Google Sheets, Excel) with color-coded tags.
- Automated: AI tools like Thematic or MonkeyLearn for sentiment analysis and theme extraction.
Quantitative Analysis for Behavior
Use behavioral data to validate or challenge feedback themes. For example:
- Feedback theme: "Fast checkout process"
- Behavioral signal: High cart abandonment rate (contradicts the feedback).
- Hypothesis: Users think checkout is fast, but hidden steps (e.g., account creation) slow them down.
Red flags to watch for:
- Positive feedback + negative behavior: Users praise a feature but rarely use it (e.g., "I love the chatbot!" but 80% of queries go unanswered).
- Negative feedback + positive behavior: Users complain about a feature but engage with it frequently (e.g., "The UI is cluttered" but high time-on-page).
- Silent churn: Users stop using the product without providing feedback (behavioral data reveals the problem; feedback is missing).
Step 3: Validate Insights with Testing
Gaps between feedback and behavior aren’t problems—they’re opportunities to test hypotheses. Use a structured approach to validate insights before investing in changes.
Hypothesis-Driven Testing
Frame gaps as testable questions. For example:
- Gap: Users rate onboarding as "easy" (feedback) but drop off at step 3 (behavior).
- Hypothesis: "Users find step 3 confusing despite positive feedback. Simplifying the instructions will reduce drop-offs."
- Test: A/B test two versions of step 3—one with the original instructions, one with simplified text and visuals.
Testing methods:
| Method | When to Use | Tools |
|---|---|---|
| A/B tests | Compare two versions of a feature, page, or flow. | Optimizely, VWO, Google Optimize |
| User interviews | Dig deeper into why users behave a certain way. | Zoom, UserTesting, Dovetail |
| Prototype feedback | Test early designs with a small group before full development. | Figma, InVision, Maze |
| Session replay analysis | Observe how users interact with a specific feature or page. | Hotjar, FullStory |
Example: A fintech app notices users praise its budgeting tool in surveys but rarely use it. After testing, they discover users struggle to categorize transactions. A simplified categorization flow increases usage by 30%.
Step 4: Prioritize Actions Based on Impact
Not all insights are equal. Prioritize changes based on impact (business goals), effort (resources required), and confidence (data strength).
The Prioritization Framework
Use a simple matrix to rank potential actions:
| Impact | Effort | Priority | Example |
|---|---|---|---|
| High | Low | Quick win | Fix a confusing error message (high drop-off + vocal complaints). |
| High | High | Strategic project | Redesign onboarding (high churn + feedback about complexity). |
| Low | Low | Low-hanging fruit | Update a help article (minor feedback + low traffic). |
| Low | High | Deprioritize | Overhaul a rarely used feature (low behavior + mixed feedback). |
Pro tip: Focus on 1–2 high-impact changes per quarter to avoid "analysis paralysis." Track outcomes to refine future priorities.
Tools to Streamline Analysis
The right tools can automate data collection, surface insights, and reduce manual work. Choose based on your team’s needs and budget.
All-in-One Platforms
Best for teams that want a unified solution for feedback and behavior.
| Tool | Strengths | Best For |
|---|---|---|
| Qualtrics | Advanced survey logic, AI-powered sentiment analysis, behavior tracking. | Enterprise teams with complex needs. |
| Medallia | Real-time feedback, journey mapping, predictive analytics. | Customer experience (CX) leaders. |
| Delighted | Simple NPS/CSAT surveys, integrations with Slack/CRM. | Small teams or startups. |
Best-of-Breed Tools
Best for teams that prefer specialized tools for feedback and behavior.
| Category | Tools | Use Case |
|---|---|---|
| Feedback | SurveyMonkey, Typeform, AskNicely | Collect and analyze survey responses. |
| Behavior | Hotjar, FullStory, Mixpanel | Track user actions, session recordings, and funnel analysis. |
| Integration | Zapier, Segment | Connect feedback tools (e.g., Delighted) with behavior tools (e.g., Amplitude). |
AI and Automation
AI tools can speed up analysis by automating repetitive tasks.
| Task | Tools | How It Helps |
|---|---|---|
| Sentiment analysis | MonkeyLearn, Thematic | Automatically categorize feedback as positive/negative/neutral. |
| Anomaly detection | Amplitude, Pendo | Flag unusual behavior (e.g., sudden drop in usage). |
| Predictive modeling | Google Analytics 4, Heap | Predict churn or feature adoption based on historical behavior. |
Pro tip: Start with tools that integrate with your existing stack. For example, if you use Slack for communication, choose a feedback tool like Delighted that sends alerts to Slack channels.
Common Pitfalls and How to Avoid Them
Even with the best data, biases and blind spots can skew analysis. Here’s how to avoid common mistakes:
1. Over-Indexing on Feedback
Problem: Loud voices (e.g., vocal complainers) dominate feedback, while silent users go unnoticed. Solution:
- Weight feedback by user segment (e.g., power users vs. new users).
- Use behavioral data to identify silent churners (e.g., users who stop engaging without providing feedback).
2. Ignoring Silent Users
Problem: Behavioral data reveals issues that feedback misses (e.g., users abandon a feature without complaining). Solution:
- Combine behavioral triggers (e.g., drop-offs) with follow-up surveys (e.g., "What made you leave?").
- Use session recordings to observe silent users’ pain points.
3. Confirmation Bias
Problem: Cherry-picking data to support preconceived ideas (e.g., "Users love this feature" because you ignore negative feedback). Solution:
- Assign a "devil’s advocate" to challenge assumptions during analysis.
- Use quantitative data to validate qualitative themes (e.g., "80% of users say X, but only 20% do Y").
4. Analysis Paralysis
Problem: Endless data collection without action. Solution:
- Set a deadline for analysis (e.g., "We’ll decide on 1–2 changes by Friday").
- Start small: Test one hypothesis at a time.
Closing the Gap Between Words and Actions
Customer feedback and behavior are not opposing forces—they’re complementary. Feedback reveals what customers want; behavior shows what they need. By analyzing both, you can:
- Spot misalignments (e.g., positive feedback + low usage).
- Validate insights with testing (e.g., A/B tests, user interviews).
- Prioritize changes based on impact and effort.
The goal isn’t to eliminate gaps—it’s to use them as a roadmap for improvement. Start small: Pick one feature or journey, collect feedback and behavior, and test a hypothesis. Over time, you’ll build a data-driven culture that turns customer insights into action.
Next step: Audit your current data collection. Do you have both feedback and behavior for your key user journeys? If not, start there.